Enterprise Resource Planning (ERP) systems have become indispensable in the modern business landscape. They offer an integrated approach to managing various business processes, from manufacturing and operations to supply chain and customer relations. However, the cornerstone of a successful ERP implementation is accurate and comprehensive requirement gathering. This is where workflow diagrams and data flow charts come into play. These visual tools serve as a roadmap, guiding businesses to understand their needs better and to articulate them more precisely. In this article, we’ll explore the critical role these diagrams play in ERP requirement gathering.
The Importance of Requirement Gathering #
Requirement gathering is not just the first step but also the foundation upon which the entire ERP project rests. It’s a phase where businesses define their needs, set objectives, and identify the gaps in their current systems. Any oversight or error at this stage can lead to a domino effect, causing delays, increased costs, and even project failure. Therefore, it’s crucial to employ effective tools and methodologies for requirement gathering, and this is where workflow diagrams and data flow charts prove invaluable.
Workflow Diagrams: The Blueprint of Business Processes #
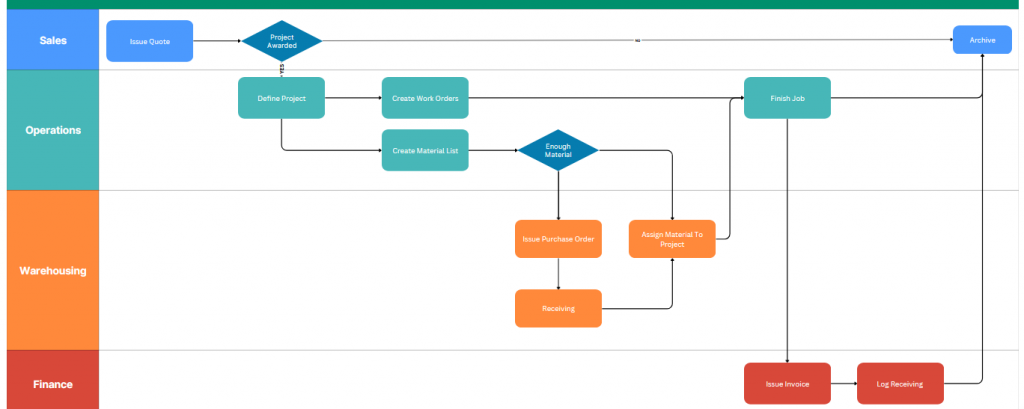
Workflow diagrams serve as a visual blueprint of the various activities and processes within an organization. They help in breaking down complex procedures into individual tasks, showing how they are interconnected. For example, in a manufacturing setup, a workflow diagram can outline the journey from raw material procurement to production and finally to the shipping of finished goods. This visual representation aids in identifying the necessary ERP modules, such as inventory management, production planning, and quality control. It also helps in spotting inefficiencies in the current system, offering opportunities for optimization.
Data Flow Charts: Mapping the Data Journey #
Data is the lifeblood of any organization, and understanding its flow is essential for successful ERP implementation. Data flow charts provide a graphical representation of how data moves and interacts between different departments and systems. For instance, in a retail business, a data flow chart can depict how customer orders flow from the website to the inventory system and then to the shipping department. This visualization helps in pinpointing the data touchpoints and ensures seamless integration between various ERP modules like e-commerce, inventory, and logistics.
Workflow diagrams and data flow charts are more than just visual aids; they are strategic tools in ERP requirement gathering. They offer a clear, organized, and detailed view of business processes and data flow, enabling companies to make informed decisions. By employing these diagrams, businesses can ensure that their ERP system is not just a software solution but a strategic asset that aligns perfectly with their operational needs and objectives.
Tools for Workflow Diagram or Data Flow Diagram (DFD) #
There are several free tools available that offer robust features for designing these diagrams. Here are some of the best free tools you can use:
1. Draw.io (also known as diagrams.net) #
- Features: Draw.io offers a wide range of templates for workflow diagrams and DFDs. It supports various export formats and allows for real-time collaboration.
- Platform: Web-based, Desktop
- Website: Draw.io
2. Lucidchart #
- Features: Lucidchart provides an intuitive drag-and-drop interface and a variety of templates. The free version offers basic features suitable for small projects.
- Platform: Web-based
- Website: Lucidchart
3. yEd Graph Editor #
- Features: yEd offers advanced layout algorithms that help in creating complex diagrams easily. It supports various diagram types, including flowcharts and network diagrams.
- Platform: Windows, macOS, Linux
- Website: yEd
4. Gliffy #
- Features: Gliffy offers a user-friendly interface and a variety of templates. It also allows for collaboration and sharing via links.
- Platform: Web-based
- Website: Gliffy
5. Creately #
- Features: Creately offers real-time collaboration and a variety of templates. The free version allows you to create up to 5 public diagrams.
- Platform: Web-based, Desktop
- Website: Creately
6. Pencil Project #
- Features: This open-source tool is great for creating simple diagrams and UI mock-ups. It offers basic shapes and elements for DFDs.
- Platform: Windows, macOS, Linux
- Website: Pencil Project
7. Cacoo #
- Features: Cacoo offers real-time collaboration and a variety of templates. The free version allows you to create up to 6 sheets.
- Platform: Web-based
- Website: Cacoo
8. Microsoft Visio Online (Free Plan) #
- Features: While the full version is paid, Microsoft offers a free online version with basic features for creating diagrams.
- Platform: Web-based
- Website: Microsoft Visio Online
These tools offer a range of features to suit different needs, from simple diagrams to complex workflows and DFDs. Choose the one that best fits your project requirements.
#ERP #RequirementGathering #WorkflowDiagram #DataFlowChart #BusinessProcesses #DataIntegration #ERPModules #ArtintechERP


