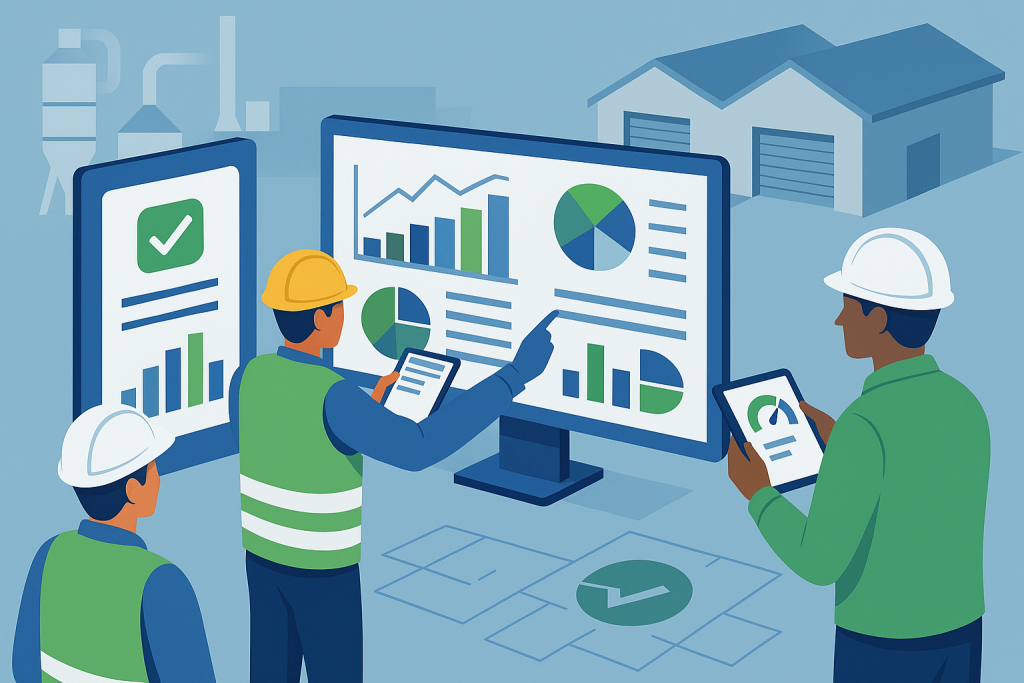
Why Data Is the New Safety Asset #
Every incident report, hazard log, and training record holds valuable clues about your organization’s risk profile. The challenge is extracting actionable insights.
Key Data Sources in Safety #
Incident and near-miss reports.
Equipment inspection logs.
Training records and completion rates.
How to Analyze Safety Data #
Identify patterns in recurring incidents.
Compare metrics to industry benchmarks.
Use predictive models to anticipate future risks.
The most valuable asset for improving safety isn’t a new piece of equipment—it’s your data. Every form, log, and report your organization generates contains crucial clues about your underlying risks. By shifting from simply collecting this information to actively analyzing it, you can transform your safety program from a reactive process into a proactive, data-driven strategy.
Uncovering Insights from Key Data Sources #
Your organization is already collecting a wealth of safety information. The key is to view these sources not as simple records, but as rich datasets waiting for analysis.
Incident and Near-Miss Reports: These are your most direct sources of insight. Analyzing them reveals not just what happened, but why. Near-miss data is particularly valuable, as it provides a free lesson on systemic weaknesses before a serious injury occurs.
Equipment Inspection Logs: Don’t just file these away. Look for patterns. Is the same machine failing inspections repeatedly? This could indicate a need for better maintenance, operator retraining, or equipment replacement.
Training Records: Correlating training completion rates with incident data can uncover critical gaps. If a department with a high incident rate also has overdue training, you’ve identified a clear, actionable problem.
How to Analyze Safety Data for Proactive Results #
Extracting actionable insights is what turns raw data into a powerful safety asset. The goal is to move beyond simply recording what happened to understanding what might happen next.
Identify Patterns in Recurring Incidents: Use data to find the common threads. Are most back injuries happening on a specific shift? Are slips and trips concentrated in one area of the facility? These patterns point directly to root causes that can be addressed systemically.
Compare Metrics to Industry Benchmarks: Your safety data gains context when compared to your industry. A low incident rate might seem good, but if it’s double the industry average, it signals a need for improvement. This helps you set meaningful, evidence-based goals.
Use Predictive Models to Anticipate Future Risks: This is the pinnacle of data-driven safety. By combining leading indicators like inspection failures, near misses, and even overtime hours, you can use predictive analytics to identify “hot spots” where future incidents are most likely. This allows you to allocate resources and intervene before someone gets hurt, representing the ultimate form of proactive risk management.
Related Reading: For key metrics to track, see the following articles:
#WorkplaceSafety #EHS #DataAnalytics #SafetyManagement #PredictiveSafety


